
Filter By
Products List
There are no products listed under this category.
An initial website build centred on floral imagery, seasonal discovery and the moments customers want to remember. Now moving into the next phase: in-depth SEO, AI visibility and technical SEO.
Visit Vanderfleet Flowers ↗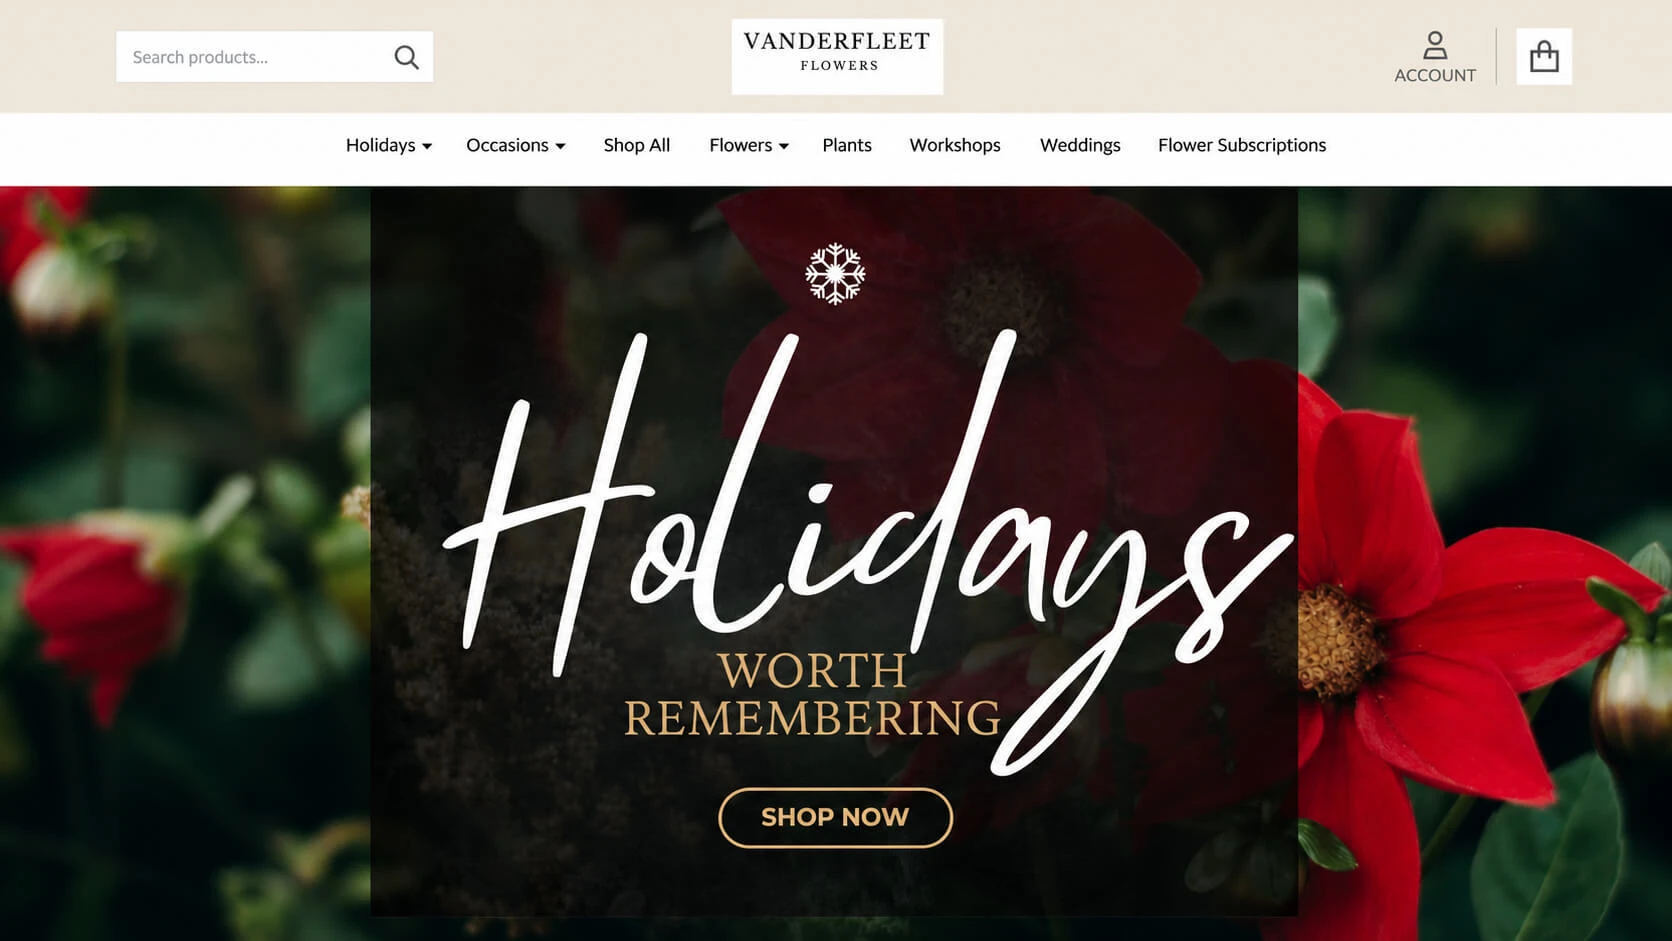
Flowers carry a message. The website helps customers find the arrangement that feels right.
The initial site build brought Vanderfleet's seasonal flowers, occasions and everyday discovery into one storefront. Large imagery introduces the character of the arrangements, while category navigation gives shoppers a starting point.
Following that foundation, we are currently working on the next phase: in-depth SEO, AI visibility and technical SEO.
The results below document the growth visible in the supplied search snapshots and store dashboard. They provide context for the work ahead.
Colour, texture and composition give each arrangement its character. Product photography brings those details into the online shopping experience.

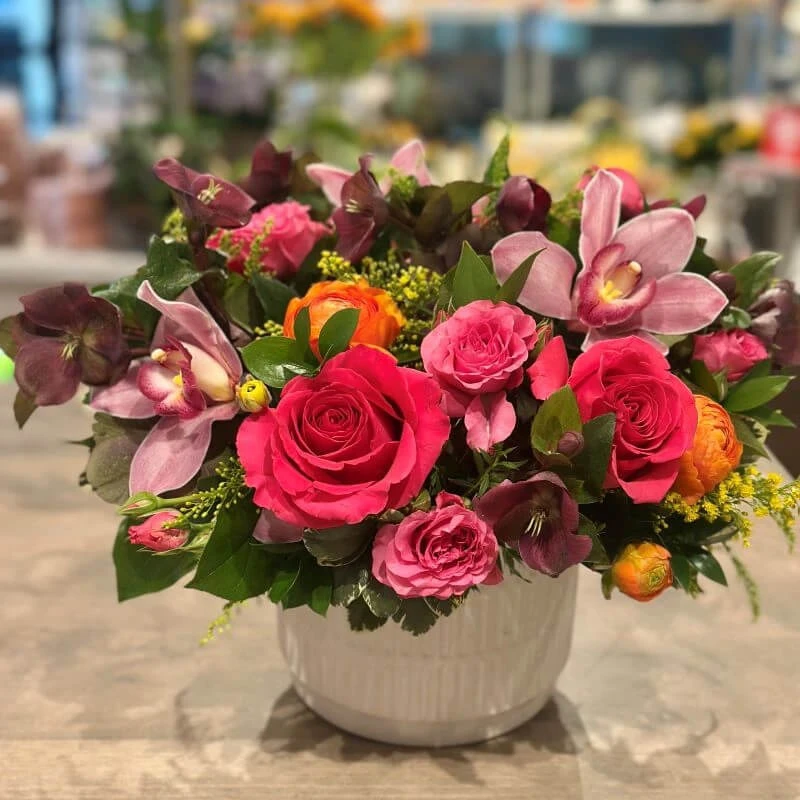
A refined presentation that gives the flowers room to stand out.
Deep blue creates a composed foundation. Cream introduces breathing room, gold adds warmth, and seasonal red brings the holiday collection forward.
The arrangements remain the focal point, supported by a restrained layout and clearly separated content.
Deep blue#192841
Warm cream#F2ECE3
Soft gold#B69A68
Seasonal red#811D2A
Seasonal collections give shoppers an immediate connection between the flowers and the moment.
Generous image areas make colour, shape and composition easier to appreciate.
Navigation by flowers, plants and occasions supports different ways of finding the right gift.
The online experience connects inspiration with practical shopping decisions.
Product imagery introduces the arrangement. Clear collections and an accessible storefront help visitors continue exploring, whether they arrive with an occasion in mind or are looking for inspiration.
Explore Vanderfleet Flowers ↗
The supplied SEMrush snapshots show estimated monthly organic traffic increasing from 299 to 1,674, alongside stronger top-three and top-ten visibility.
299 → 1,674 monthly visits
368 → 449 standard positions
4 → 12 positions ranking 1–3
20 → 57 positions ranking 1–10
Estimated monthly organic visits
Two supplied snapshots. Dashed line compares endpoints.
Combined standard positions ranking 1–100
Excludes AI Overviews and other SERP features.
Search positions ranking 1–3
Three times the starting number of top-three positions.
Combined search positions ranking 1–10
Combines positions 1–3 and positions 4–10.
| Metric | Sep 2023 | Oct 2026 | Change |
|---|---|---|---|
| Estimated organic traffic | 299 | 1,674 | +460% |
| Estimated branded traffic | 256 | 1,458 | +470% |
| Estimated paid traffic | 0 | 16 | +16 |
| Positions 1–3 | 4 | 12 | +200% |
| Positions 4–10 | 16 | 45 | +181% |
| Positions 11–20 | 60 | 60 | No change |
| Positions 21–50 | 91 | 175 | +92% |
| Positions 51–100 | 197 | 157 | −20% |
| Standard organic positions | 368 | 449 | +22% |
| AI Overviews | 0 | 1 | +1 |
| Other SERP features | 3 | 14 | +11 |
| Displayed total including features | 371 | 464 | +25% |
Source: supplied SEMrush screenshots, September 2023 and October 2026. Traffic is a third-party estimate. Branded traffic is a subset of organic traffic, not an additional total. Ranking figures are position counts, not necessarily unique keywords. Percentages are rounded. Graphs connect two snapshots and do not depict the intervening monthly trend. Each vertical scale begins at zero. These historical results are not presented as outcomes of the next phase currently in progress.
The supplied store dashboard shows substantial revenue and order growth, alongside an improvement in the reported conversion rate.
Compared with the dashboard's “last year at this time” revenue figure.
Same-time-last-year comparison.Compared with the dashboard's “last year at this time” order figure.
Same-time-last-year comparison.The 2026 year-to-date conversion rate compared with the previous full-year rate.
Different reporting windows; not a matching year-to-date comparison.Source: supplied BigCommerce dashboard with Vanderfleet Flowers selected. Revenue and order growth use the displayed “last year at this time” values. Conversion growth is a relative increase, not a percentage-point change, and compares the current year-to-date rate with the prior full-year rate. All percentages are rounded. Store results include all traffic sources and are not attributed solely to SEO or website design.
After the initial site build, we are currently working on in-depth SEO, AI visibility and technical SEO.
This next phase focuses on strengthening how Vanderfleet is discovered, understood and represented across search experiences.
Connect your website, product presentation and search strategy around the moments that matter to your customers.
Let's talk about your project ↗There are no products listed under this category.
